Monitor dashboard
The --monitor (-m) flag opens a tabbed TUI control panel alongside
the sandbox shell. It’s most useful when you want to observe what the
sandbox is doing — which outbound connections it’s making, which are
being blocked by policy, and how it’s using CPU and memory.
airlock start --monitor
Tabs
- F1 — Sandbox: the embedded VM terminal, with 1000 lines of mouse-wheel scrollback. Alternate-screen apps (vim, htop, …) use the guest’s own screen and don’t have scrollback, just like in a normal terminal.
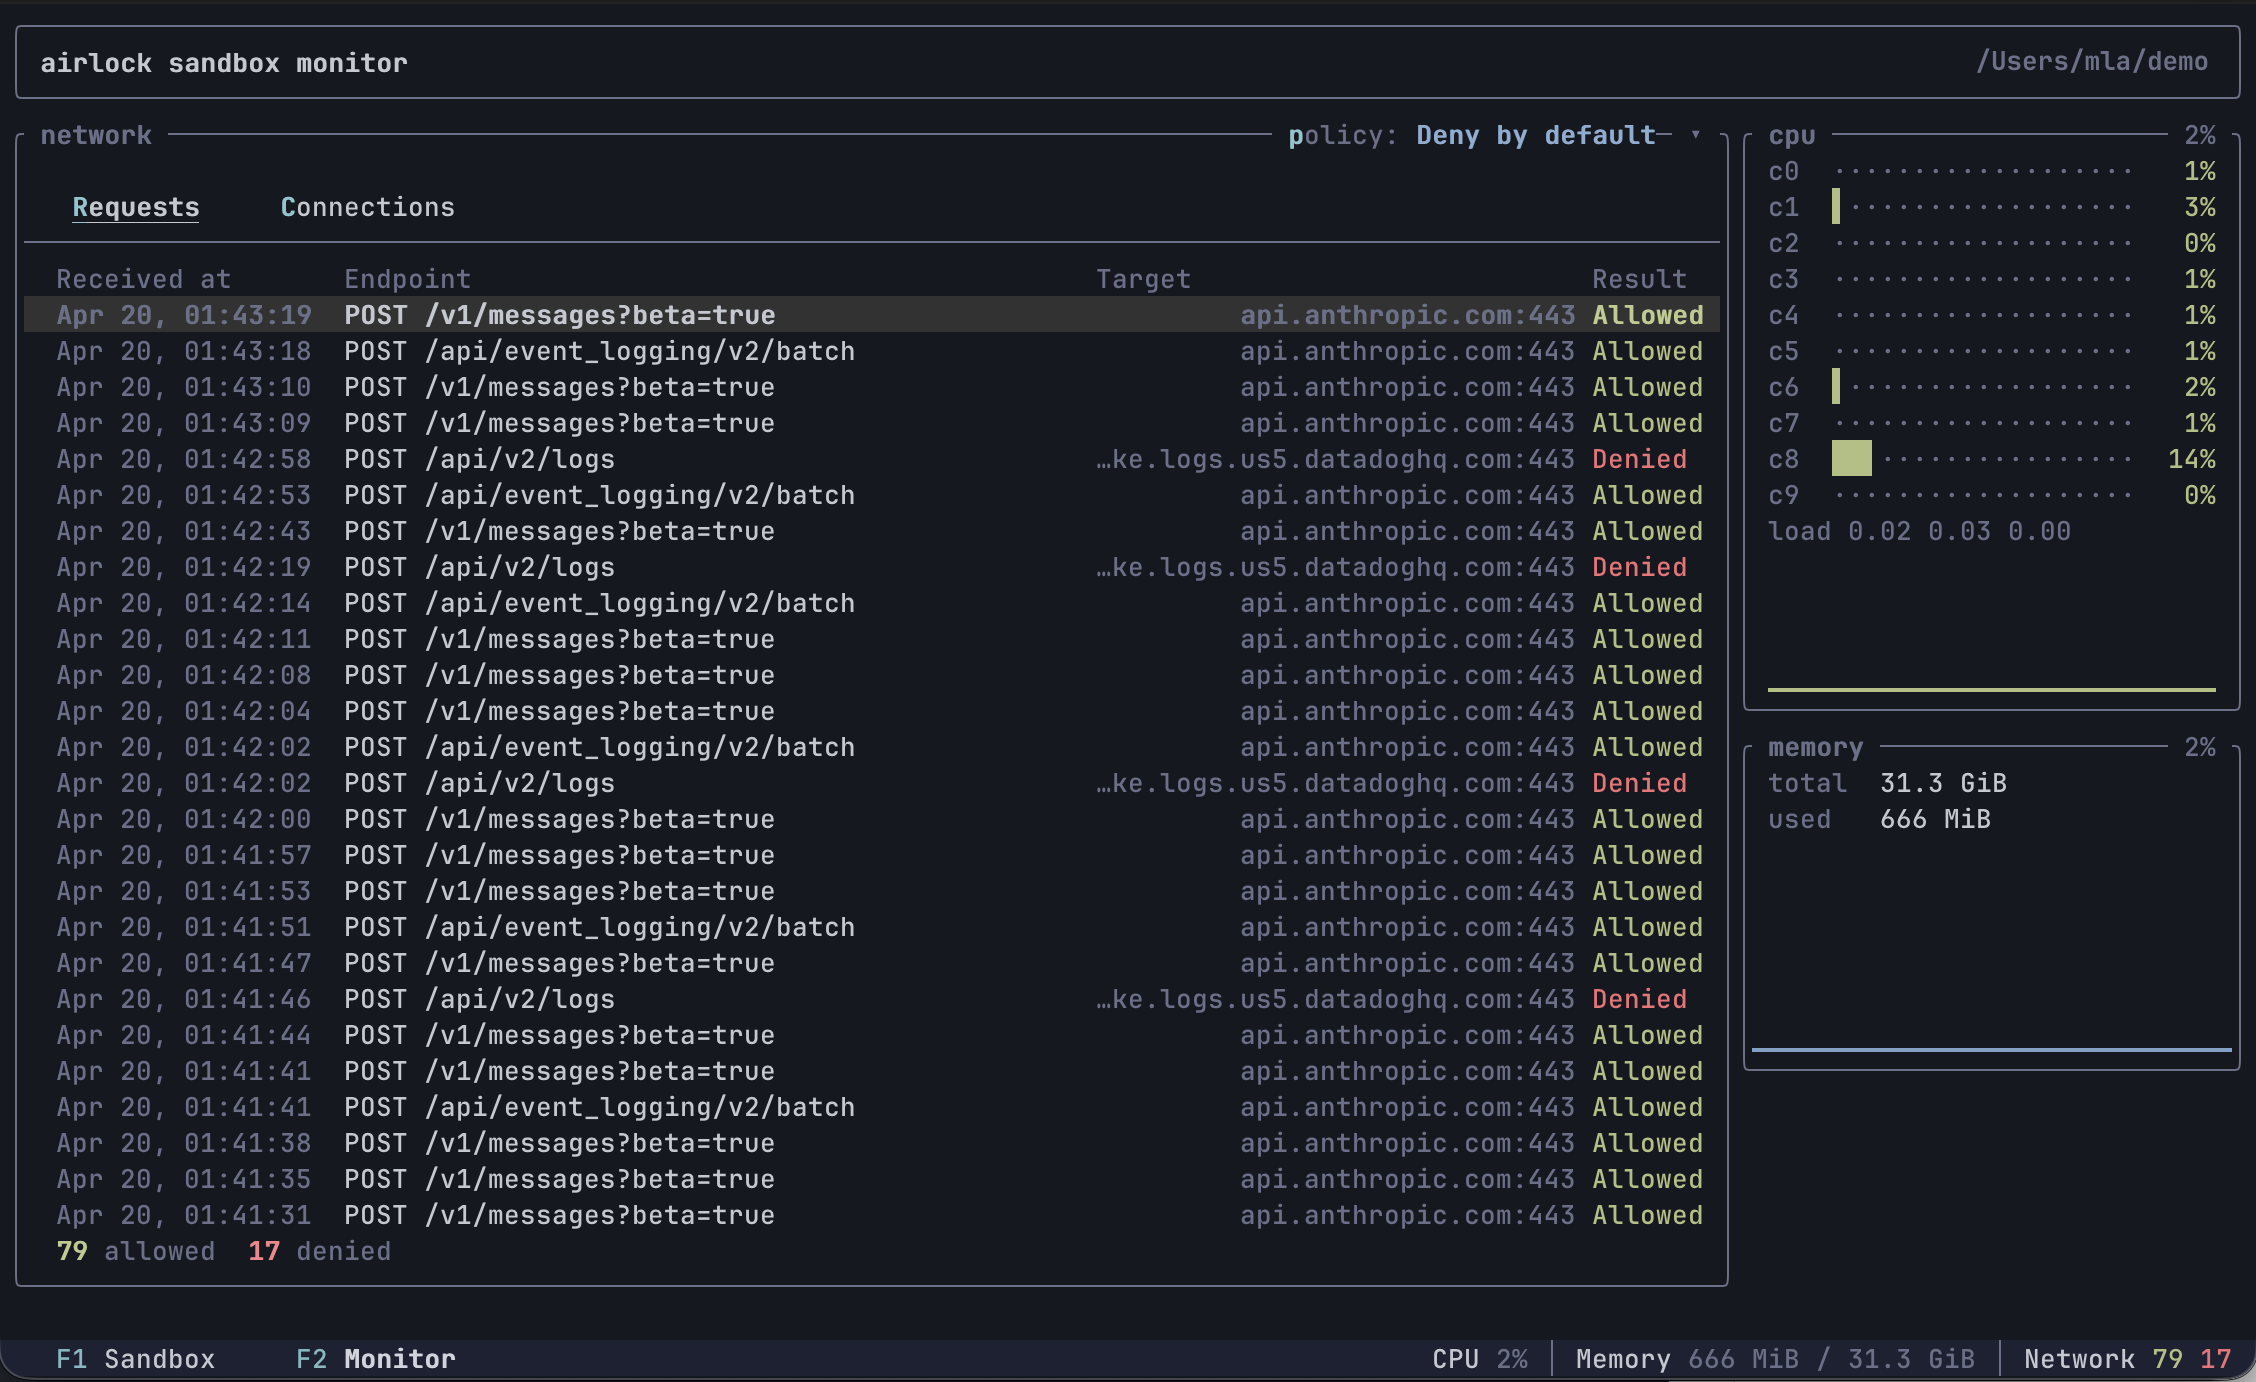
- F2 — Monitor: sandbox-wide observability. The left side shows a network panel with Requests (HTTP method, path, host, port, allow/deny) and Connections (raw TCP allow/deny) sub-tabs. The right side shows CPU and memory widgets sourced from the guest VM once per second.
Monitor tab
Network panel
Two sub-tabs (newest entries at the top, up to 100 of each). Both have a gray header row naming the columns.
- Requests (default) — one row per HTTP request the middleware
handled. Columns:
Received at,Endpoint(method + path),Target(host:port),Result(Allowedgreen /Deniedred). Denied HTTP requests are included here too: the proxy captures the full request before responding with403 Forbiddeninstead of refusing at the TCP layer, so you can see exactly what was attempted. - Connections — one row per raw TCP connection. Columns: a colored
⦿bullet,Target(host:port, white),Connected at,Disconnected at,Result. The bullet signals connection lifecycle: green means the connection is still open (Disconnected atis blank), gray means it closed, red means the connection was denied. A footer tracks running allow/deny counts.
Use ↑ / ↓ to move the row selection (PgUp/PgDn, Home, End also
work), and press Enter to open a details sub-tab with the full
snapshot — including captured request headers for HTTP. Close it with
Esc, x, or the × in the tab label.
Switch sub-tabs with r / c or click the sub-tab labels (mouse
capture must be on — see below).
Policy selector
The top-right of the network panel shows the active policy (e.g.
policy: Deny by default ▾). Press p or click the label to open a
dropdown and pick a new policy live — the change takes effect on the
next connection the sandbox makes. Colors hint at the strictness:
green (Always allow), blue (*-by-default), red (Always deny).
CPU widget
One row per guest CPU core, with a utilization bar and trailing percentage that both ramp green → yellow → orange → red with load. Below the per-core rows is the guest’s 1/5/15-minute load average and a short history sparkline of the mean utilization across cores.
Memory widget
Total and used bytes (reported the way free and htop do:
used = MemTotal - MemAvailable), plus a history sparkline of used%.
Keyboard shortcuts
| Key | Action |
|---|---|
F1 | Switch to Sandbox tab |
F2 | Switch to Monitor tab |
r | On Monitor tab: show Requests sub-tab |
c | On Monitor tab: show Connections sub-tab |
↑ / ↓ | Move row selection in Requests / Connections |
PgUp / PgDn | Jump the selection a page at a time |
Home / End | Jump to the newest / oldest entry |
Enter | Open the selected row in a details sub-tab |
Esc / x | Close the details sub-tab |
p | On Monitor tab: open the policy dropdown |
q | On Monitor tab: switch back to Sandbox tab |
Ctrl+D | On Monitor tab: ask the sandbox process to exit |
Personal settings
Buffer caps, terminal scrollback, and key bindings are personal
preferences — they live in ~/.airlock/settings.toml, not in the
per-project airlock.toml. All fields default to the values used
here, so there’s nothing to set unless you want to change them.
Buffer caps and scrollback
The Monitor tab keeps a rolling buffer of recent network activity. Once either buffer fills up, the oldest entries are dropped to make room for new ones (the lifetime allowed/denied counters are not affected). The Sandbox tab’s vt100 terminal keeps a separate scrollback buffer.
[monitor.buffers]
http = 100   # default; max HTTP request entries
tcp = 100   # default; max TCP connection entries
scrollback = 1000  # default; vt100 scrollback rows for the Sandbox tab
Bumping the buffers helps long sessions keep more history visible;
bumping scrollback lets you scroll further back into long build
output. Both are in-memory and don’t persist across sandbox restarts.
Key bindings
Shortcuts live in [monitor.keys] as an action-name → key(s) map.
Each value is either a single key string or a list of keys. Only the
actions you list here are overridden — the rest keep their defaults,
so a single back = "esc" is a complete config.
[monitor.keys]
switch-sandbox = "f1"               # force-switch to Sandbox tab
switch-monitor = "f2"               # force-switch to Monitor tab
back = "q"                # step back: list → Sandbox tab; modal → close
cancel = ["esc", "x"]       # dismiss the topmost modal
confirm = "enter"            # open details / apply policy
kill-sandbox = "ctrl+d"           # send SIGHUP+SIGTERM to the sandbox process
select-up = "up"
select-down = "down"
select-page-up = "pageup"
select-page-down = "pagedown"
select-newest = "home"
select-oldest = "end"
toggle-sub-tab = ["tab", "left", "right"]   # Requests ↔ Connections
select-requests = "r"
select-connections = "c"
open-policy = "p"                # open the network-policy dropdown
Key string format
[<modifier>+]*<key>. Modifiers (case-insensitive): ctrl, alt (or
option / meta), shift, super (or cmd / command). Keys:
- single ASCII chars:
q,1,+,?, … - named keys:
enter,esc/escape,tab,backspace,delete,space,up,down,left,right,home,end,pageup,pagedown,f1–f12
Examples: q, ctrl+d, shift+tab, f2, alt+enter.
shift+<letter> is treated the same as the lowercase letter — terminals
emit shifted letters as plain uppercase chars without a separate modifier
flag, so binding shift+a would never fire. Use a different modifier or
key if you want a shifted variant.
Action semantics
Actions are context-aware — back and confirm mean different things
depending on what’s open:
| Action | List view | Details pane | Policy dropdown |
|---|---|---|---|
back | switch to Sandbox tab | close details | close dropdown |
cancel | (no-op) | close details | close dropdown |
confirm | open details | (no-op) | apply highlighted policy |
The navigation actions (select-*, toggle-sub-tab, open-policy,
kill-sandbox) only apply on the Monitor tab. The Sandbox tab is full
keystroke passthrough — only the two switch-* shortcuts are intercepted.
Invalid key strings (unknown modifier, unknown key name) are reported up front when the sandbox starts; airlock refuses to launch the TUI rather than silently dropping a binding.
Selecting text
Clicking inside the Sandbox tab releases mouse capture so the host
terminal can handle drag natively — select text with the mouse and
copy it with your terminal’s copy shortcut (Ctrl+C on most Linux
terminals, Cmd+C on macOS). The footer shows a Selection mode
hint while capture is released. Press Esc or Ctrl+C to restore
mouse capture so clicks route back into the TUI.
The first click in the Sandbox tab is consumed by the mode switch itself; start the drag on the next press.